Skip to contents

Introduction

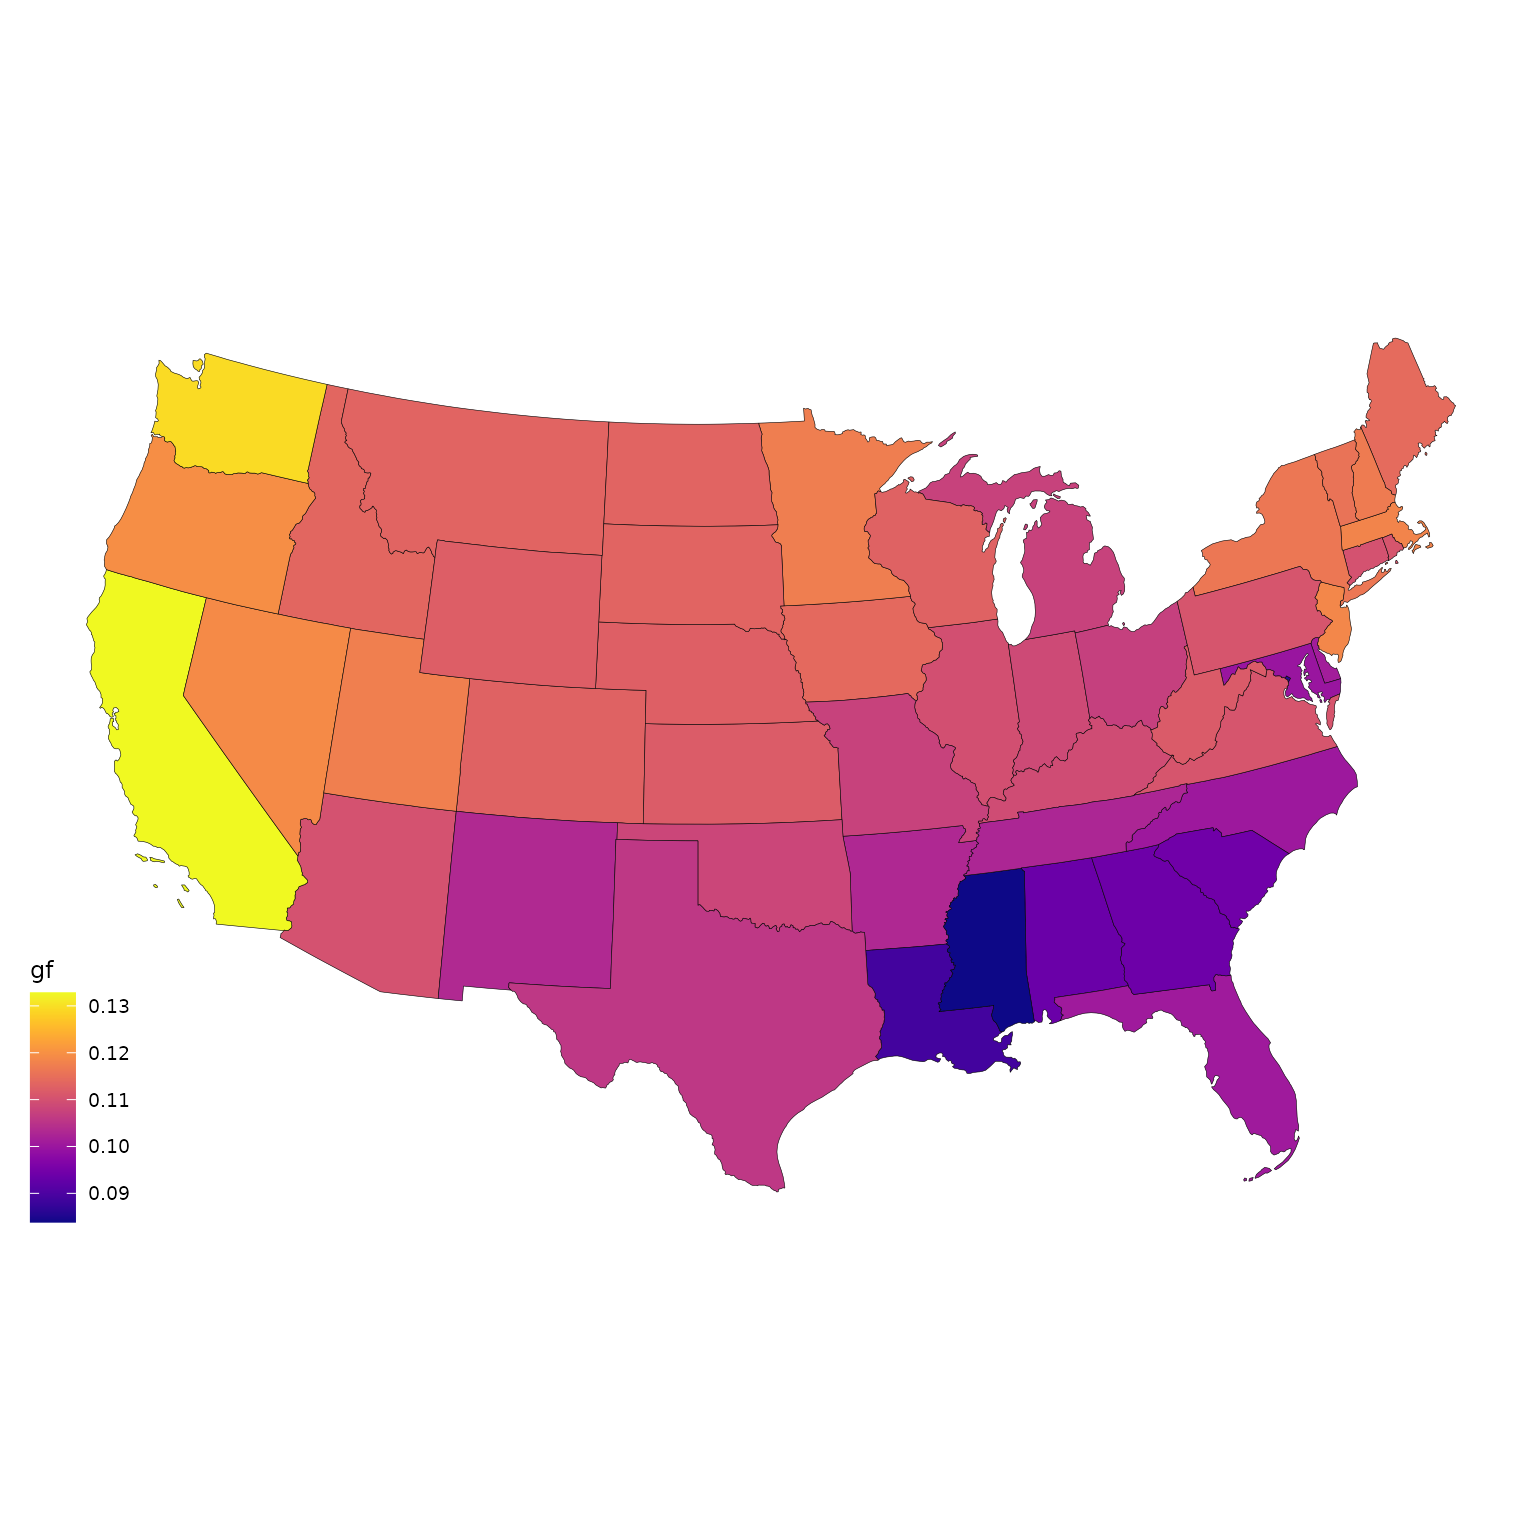
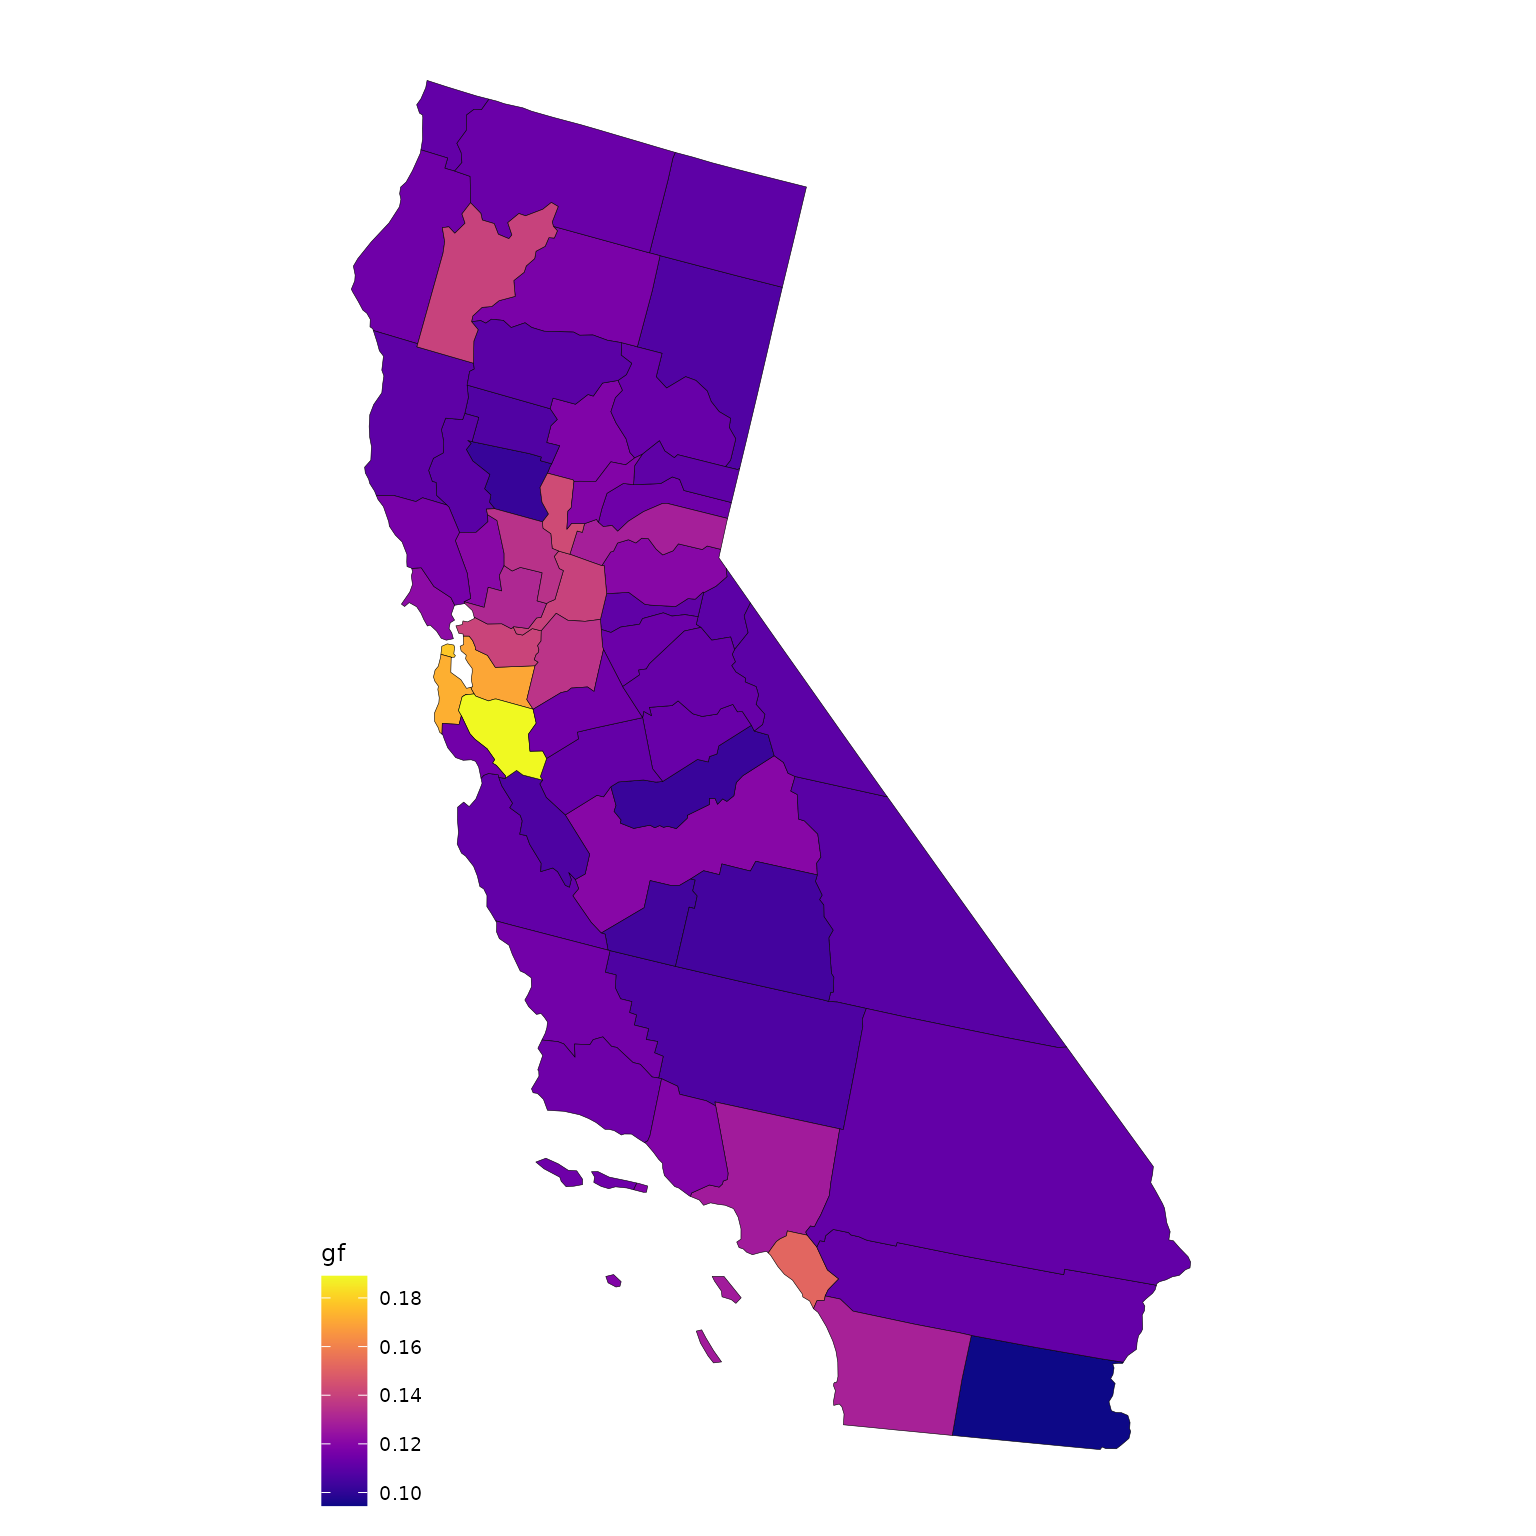
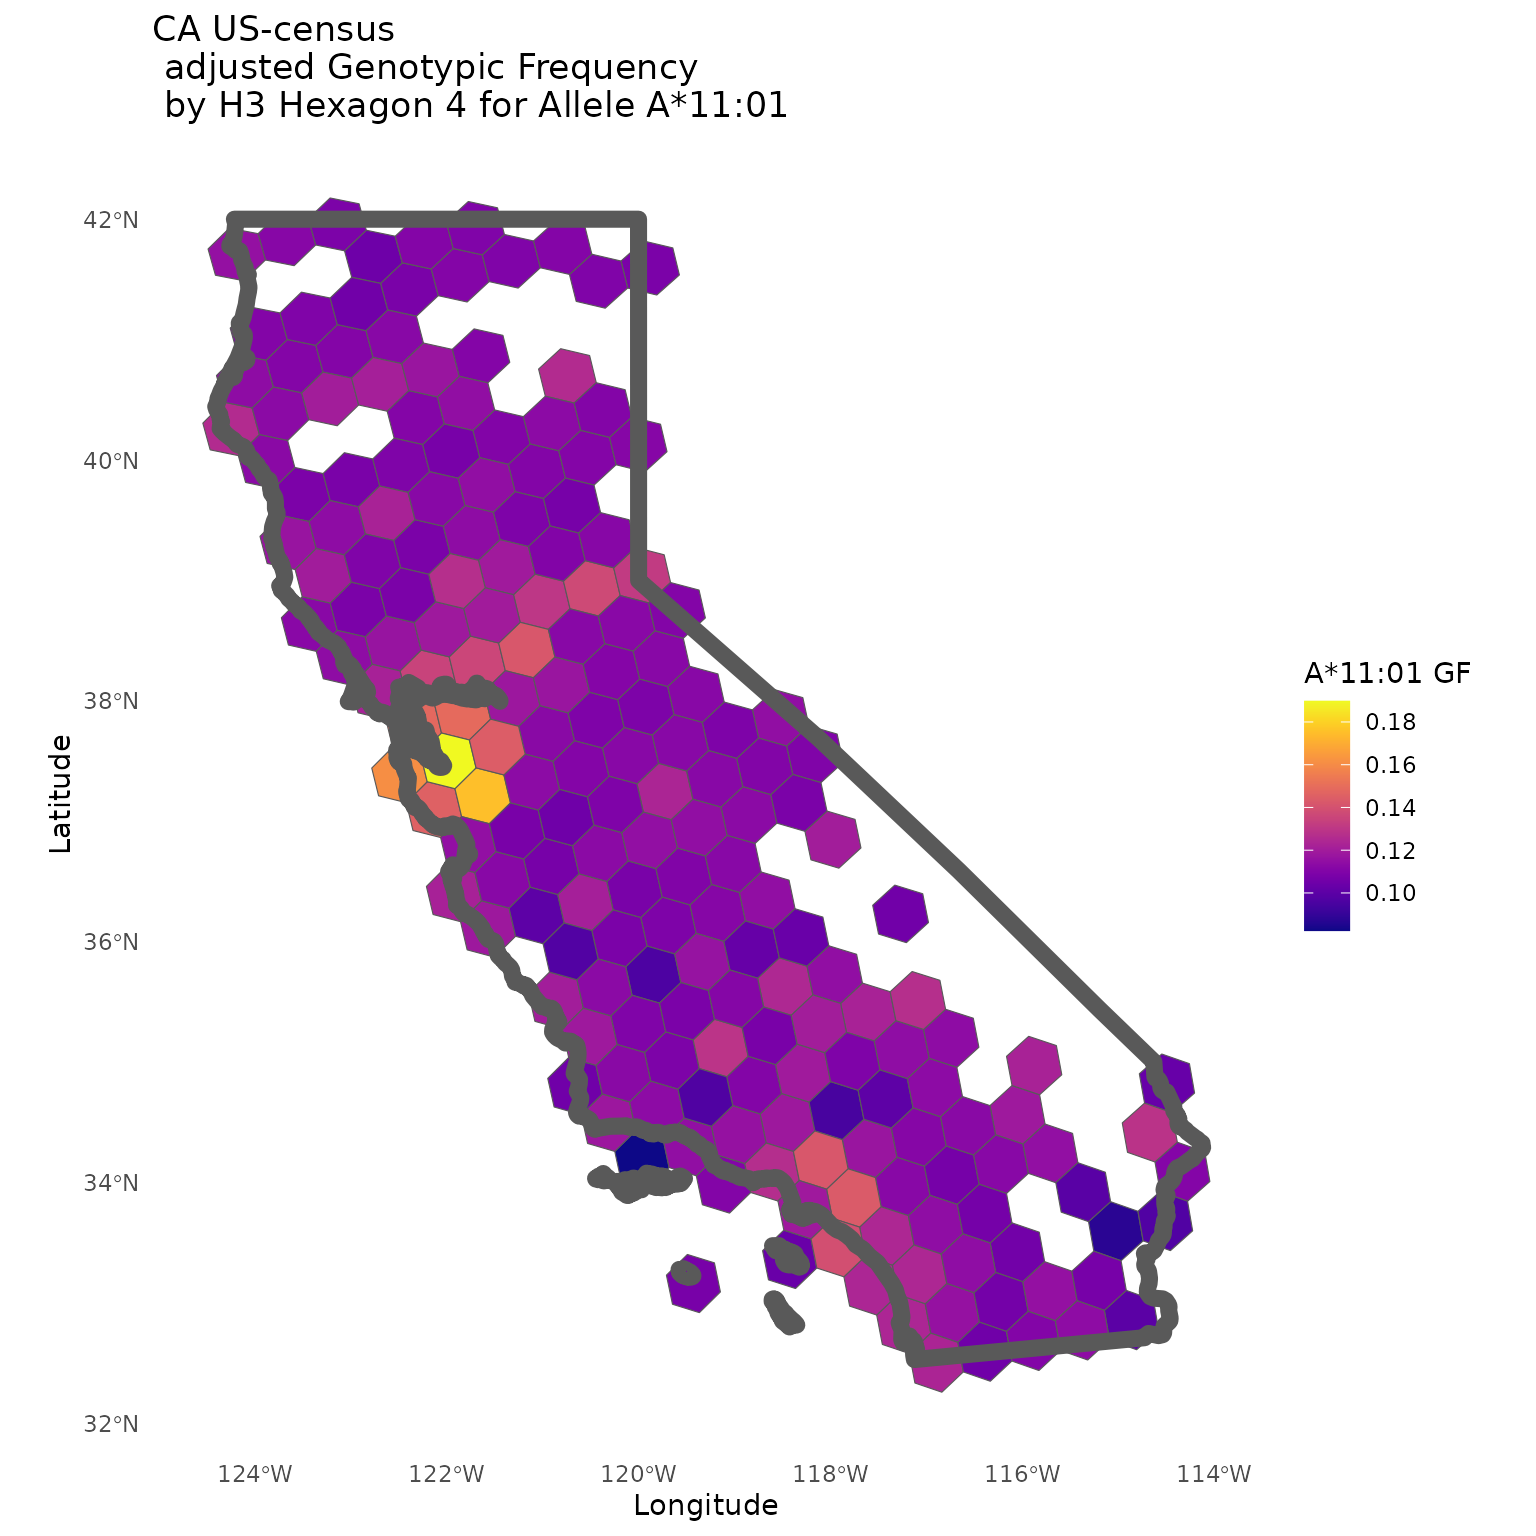
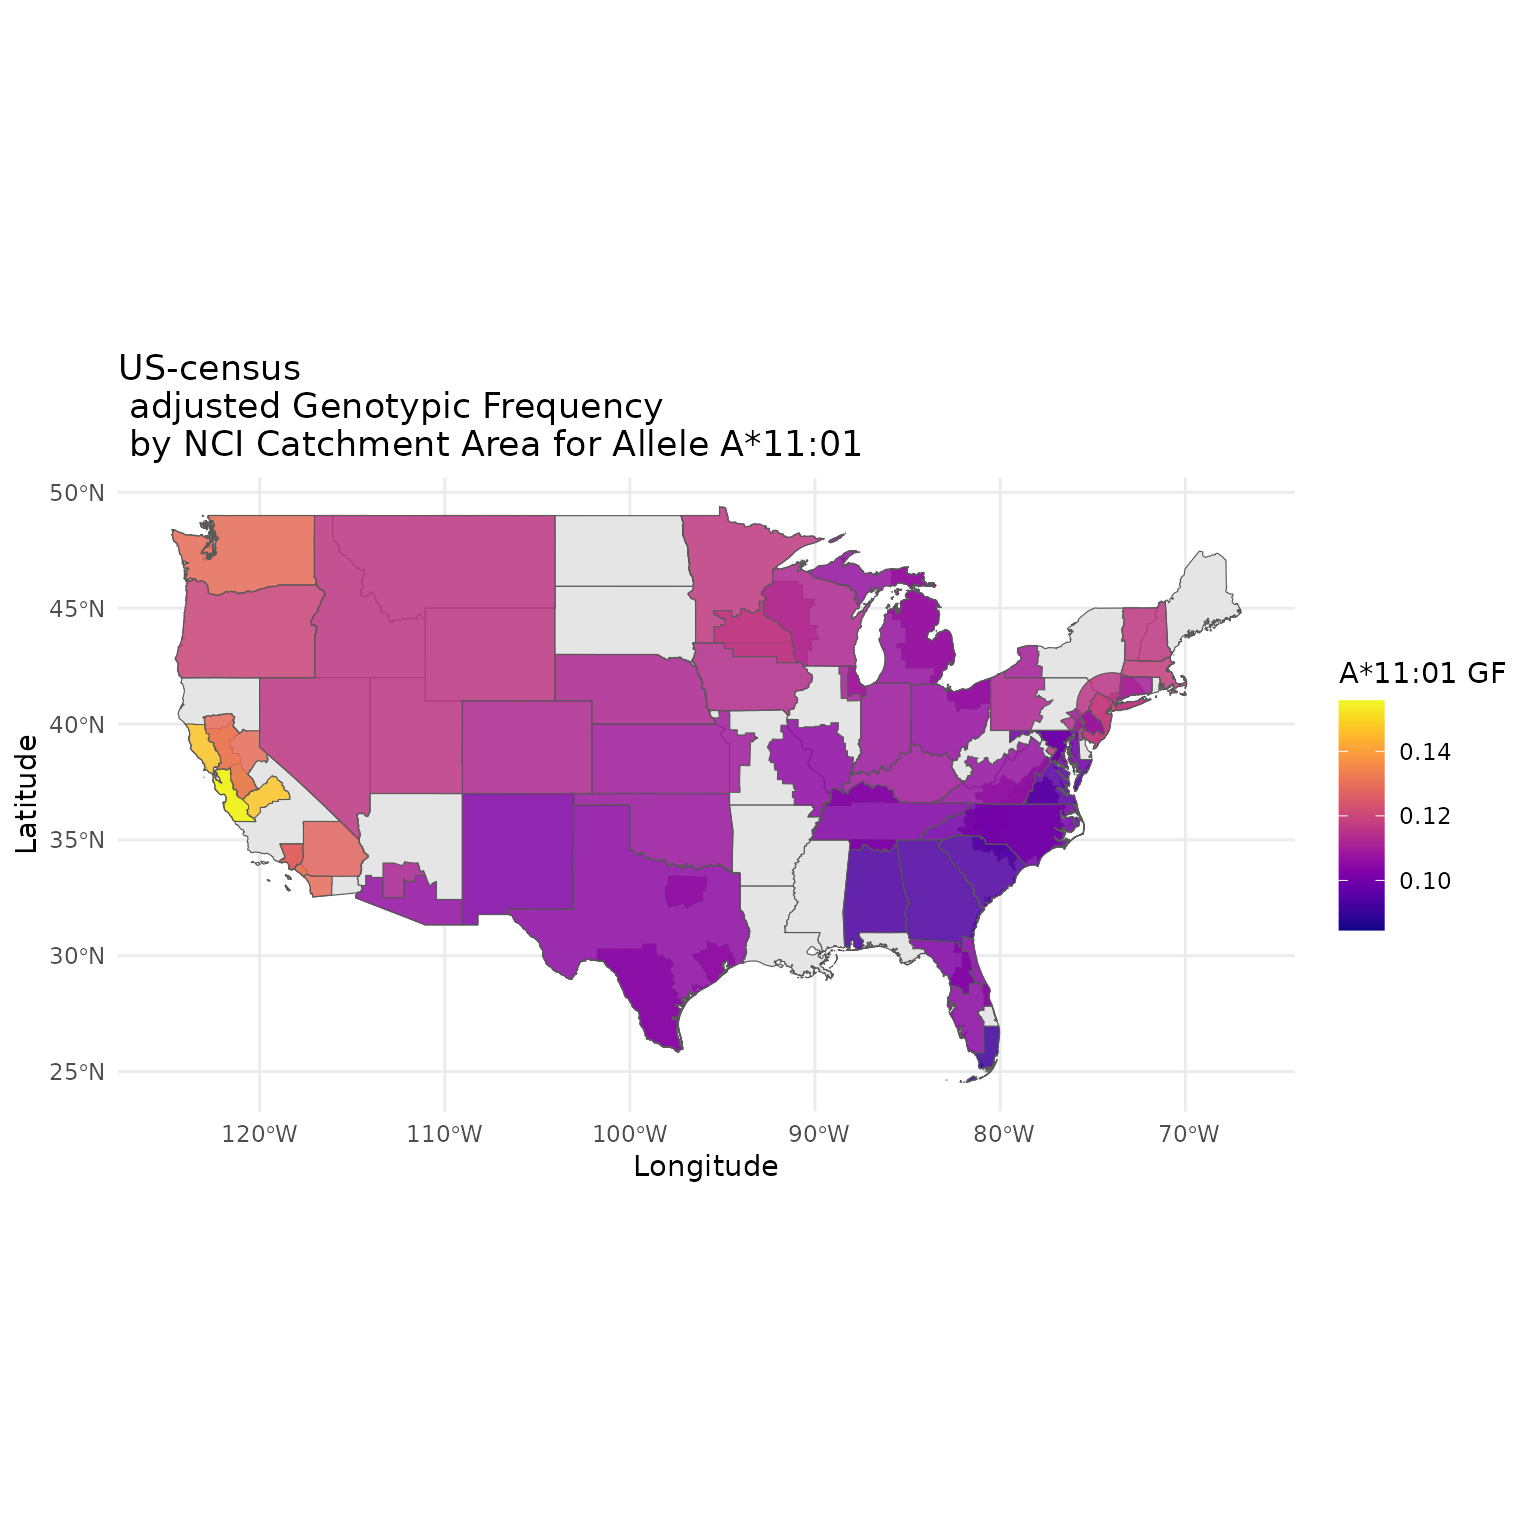
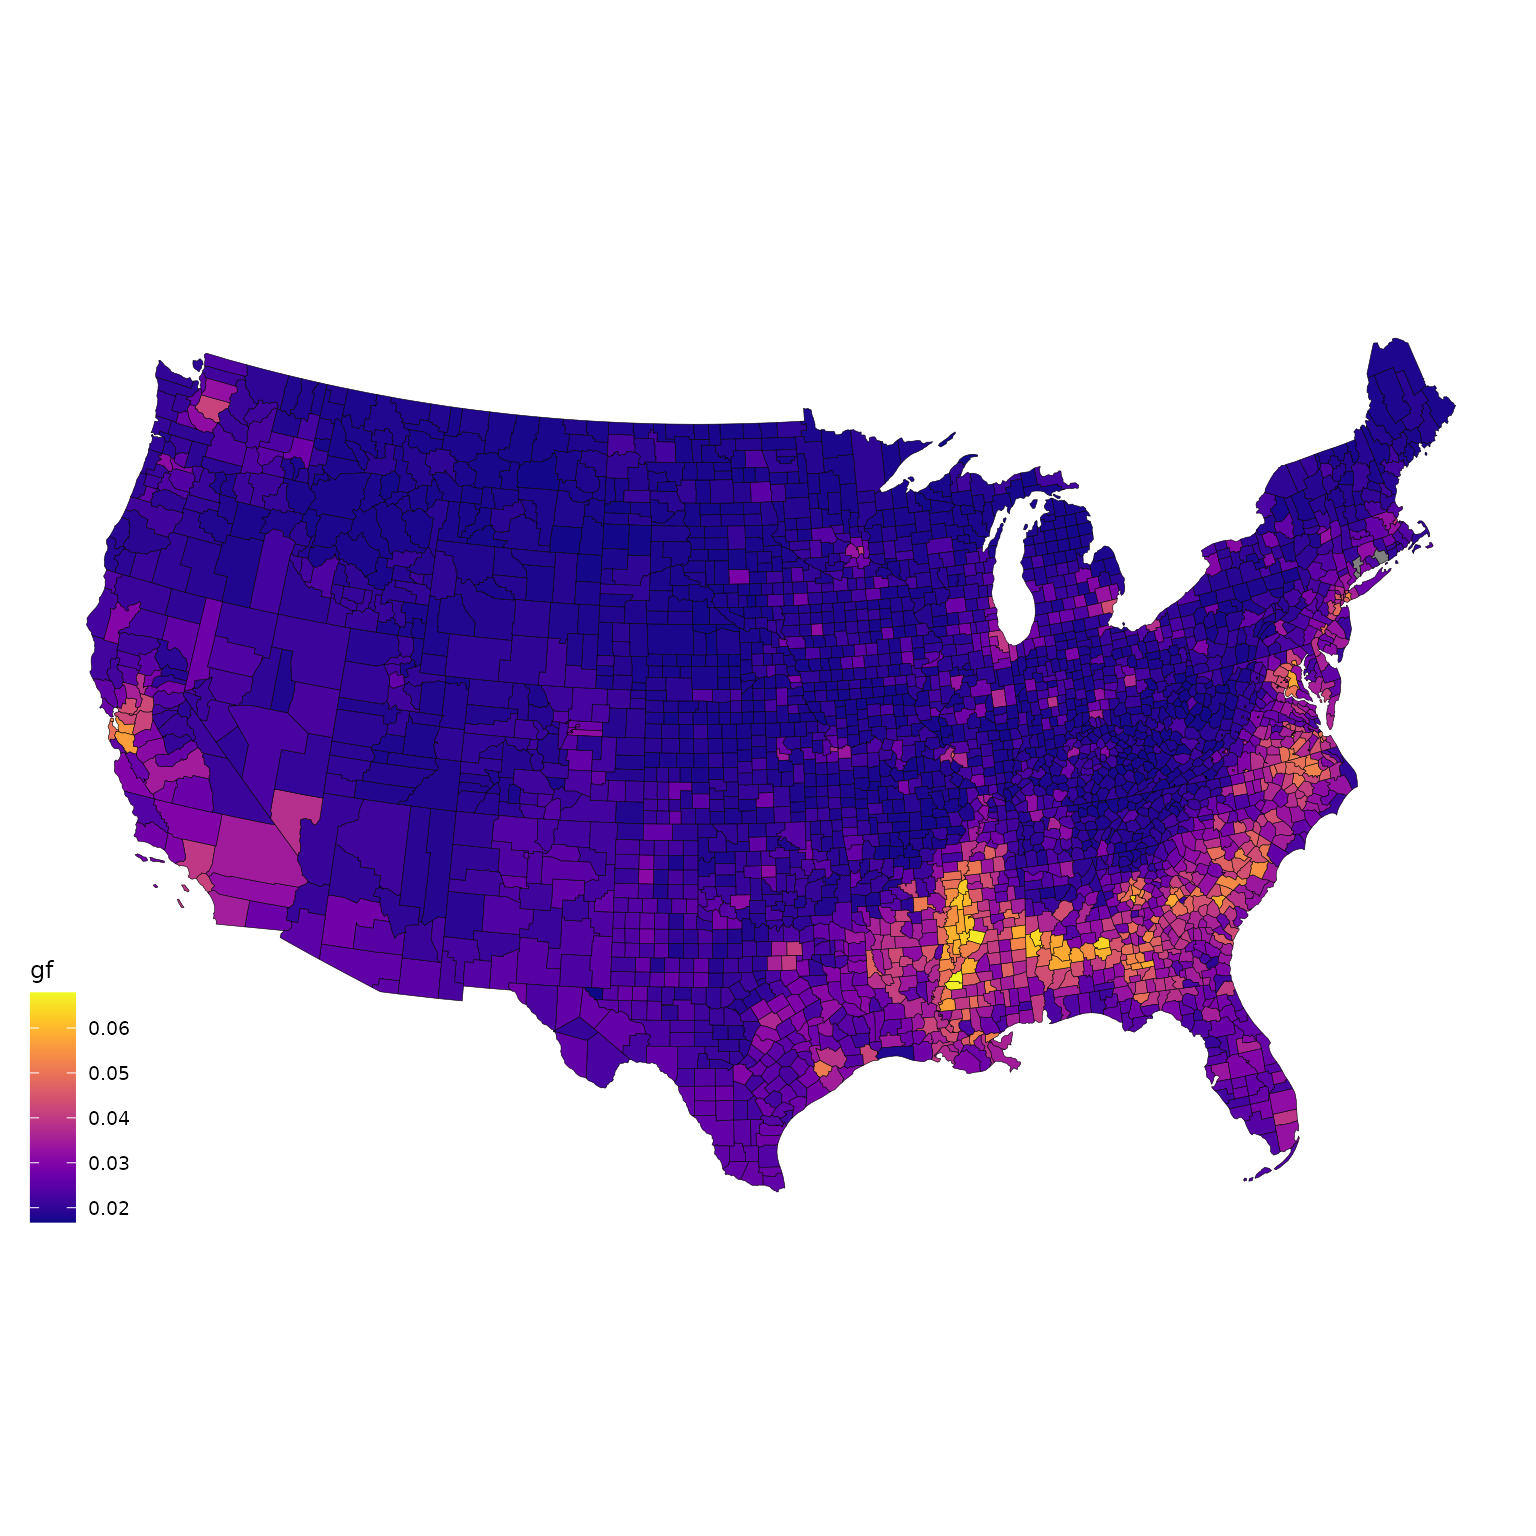
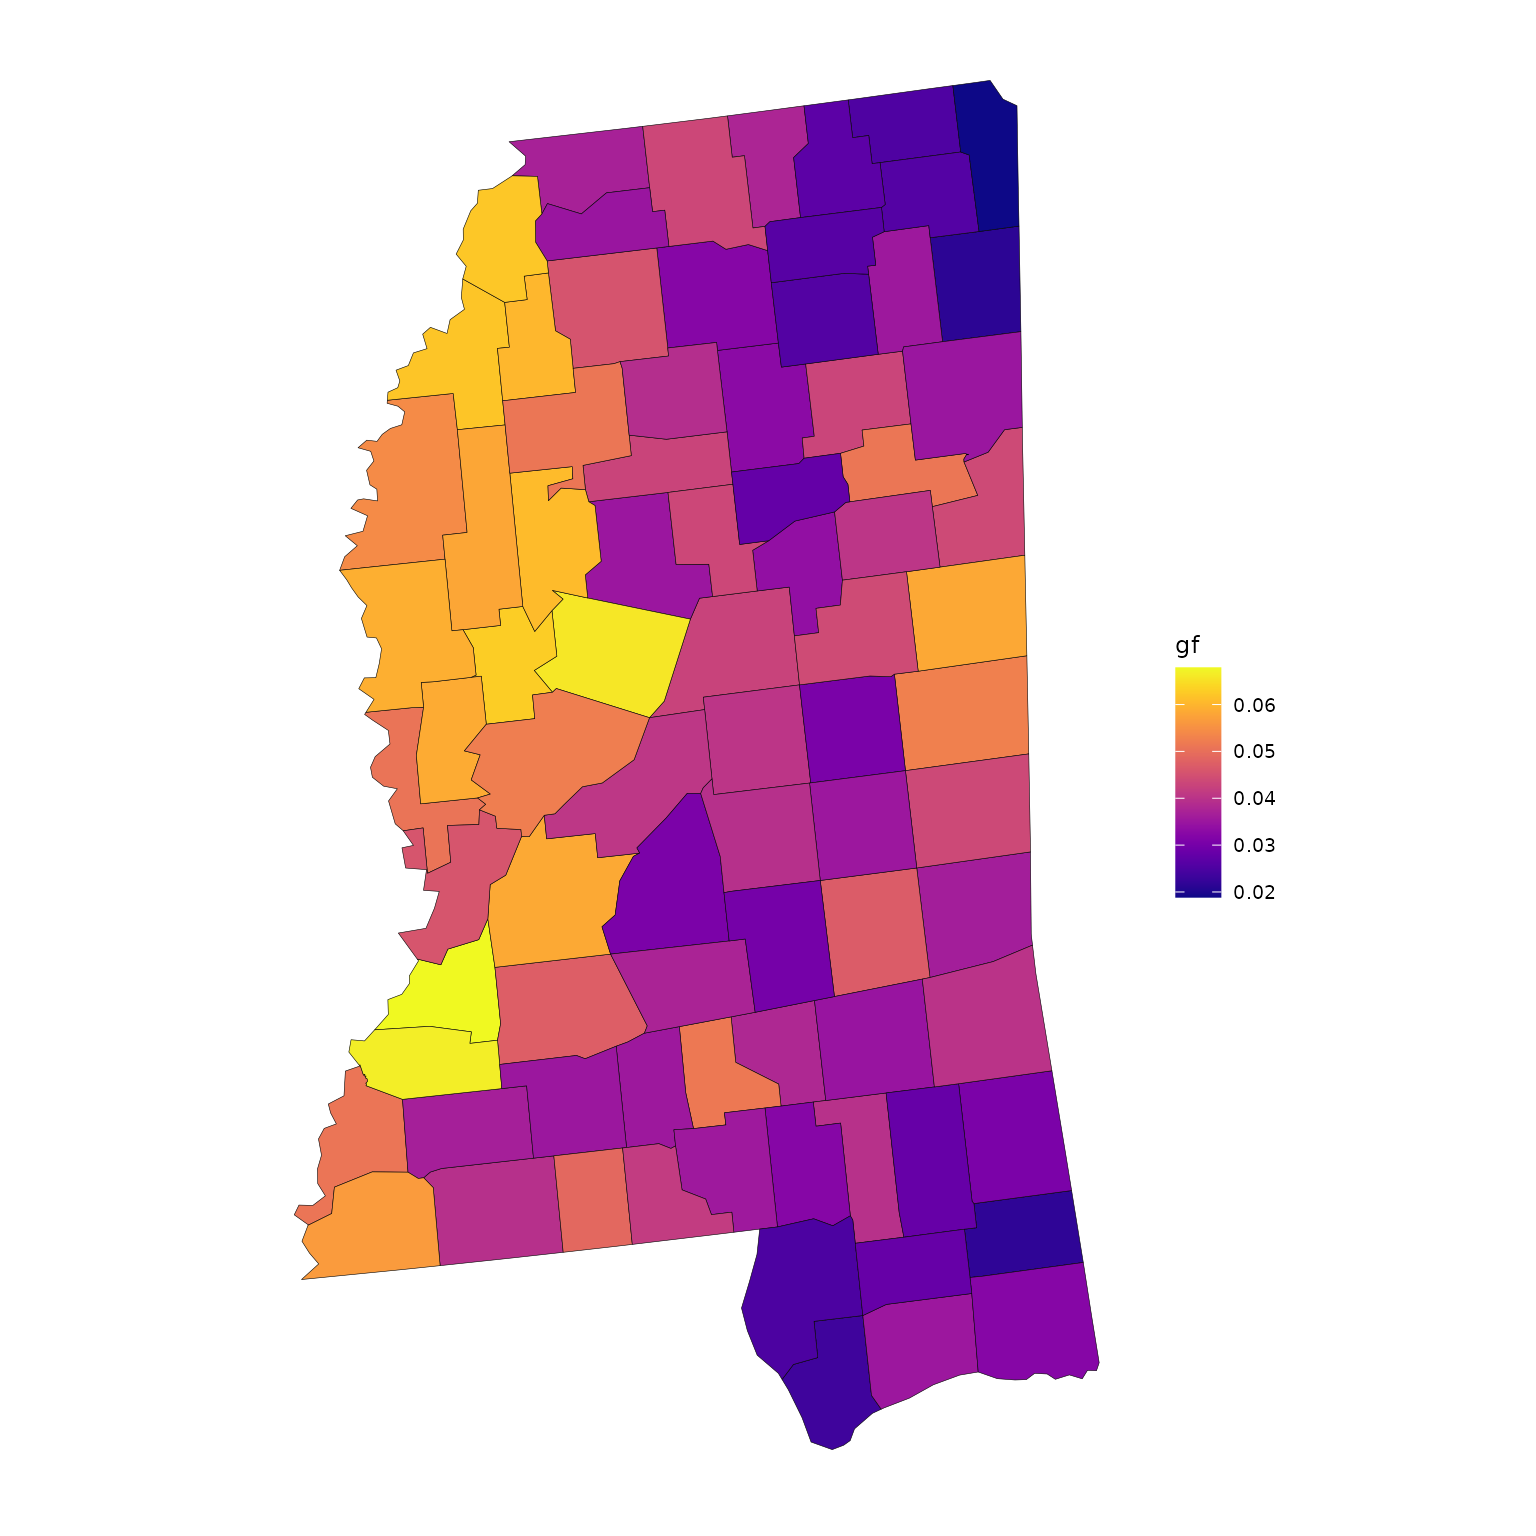
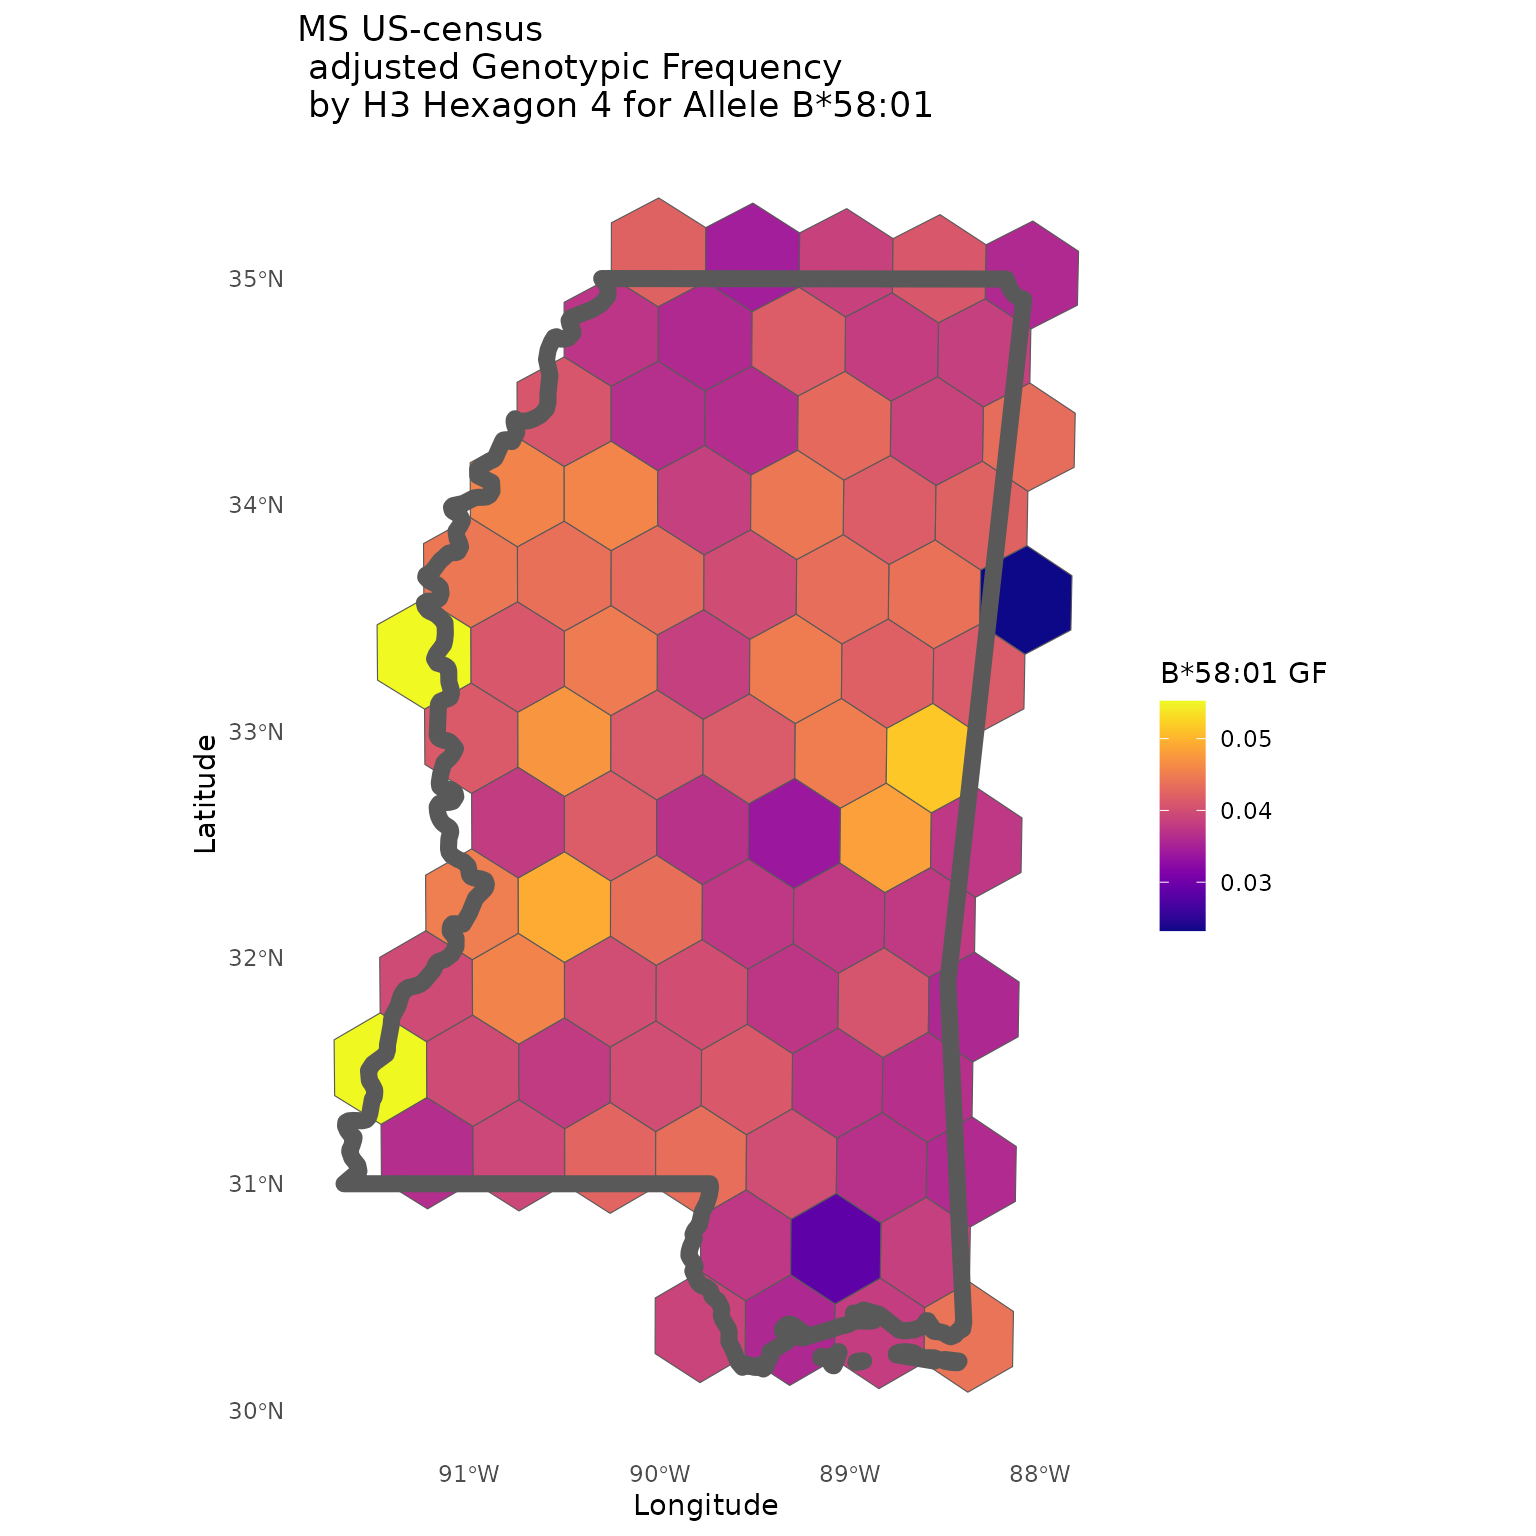
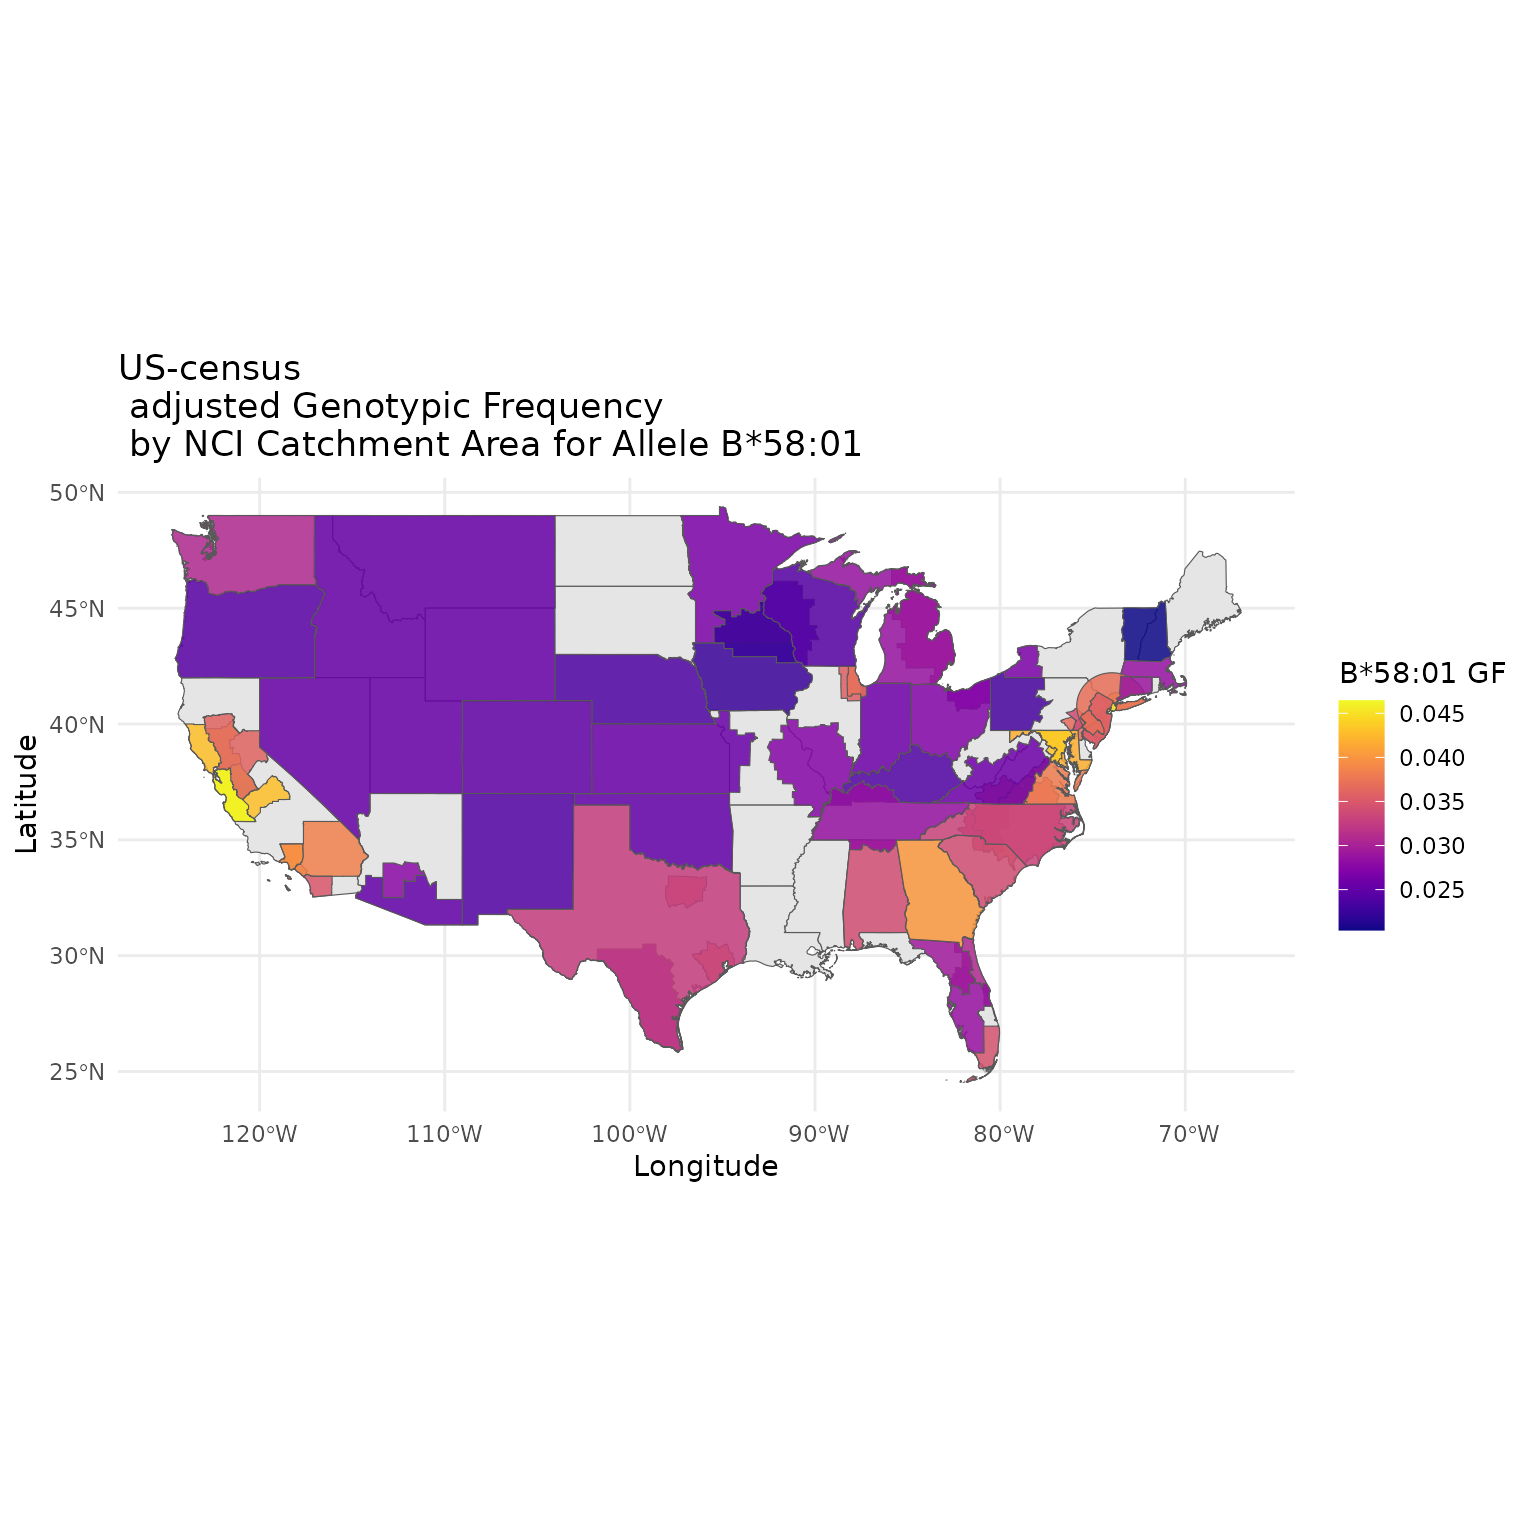
  • This page is provided as a resource to all summary genotypic frequencies used in figures and/or tables of Roy2025. They are specific to A*11:01 or B*58:01 and the respective states, counties, hexagons, or catchment areas. If interested in different HLAs, please read on.
  • Once a user has downloaded all the requisite source information per the package’s instructions, you can build the package and use the same functions and approach used for this vignette, but substitute your HLA or region of interest.

Figure 1

1A - Continental US A11


1B - A11:01 by County


1C - NDMP Correlations

NMDP Values are not publicly available for privacy reasons. Please contact co-Author Martin Maiers for inquiries.


1D - A11:01 by CA County


1E - A11:01 by CA by H4 Hexagon


1F - A11:01 Catchment


Figure 2

2A - B58:01 by County


2B - B58:01 in MS by County


2C - B58:01 in MS by Hexagon


2D - B58:01 Catchment


Tables

Table 1: United States 2020 Census Adjusted HLA-A*11:01 Genotypic Frequencies


Table 2: HLA-A*11:01 Population-adjusted genotypic frequencies for top 11 NCI Catchment areas.


Supplemental Tables

Supplemental Table 1 - California County population-adjusted HLA-A*11:01 Genotypic frequencies


Supplemental Table 2 - United States 2020 Census Adjusted HLA-B*58:01 Genotypic Frequencies for Mississippi


Supplemental Table 3 - Mississippi County population-adjusted HLA-B*58:01 Genotypic frequencies


Supplemental Table 4 - HLA-B*58:01 Population-adjusted genotypic frequencies by NCI Catchment areas


References